From Record Research to Real-World Context: How Utility Data Moves from Desktop to Dig Site
Written by

Tamar Shafrir
Published on
June 10, 2026

.png)
Table of contents
Having utility data is one thing. Using it effectively is another. It’s like starting off on a road trip with the precise longitude and latitude of your destination but without a turn-by-turn map to get you there — yes, you know the destination, but you lack the directions to make that information truly useful to your trip.
Our recent “Mapping the Hidden City” webinar focused on how utility mapping information is often disconnected from design workflows and field execution, and how agencies can better integrate data into their real-world workflows. That includes how they can integrate utility mapping into design coordination, communicate underground constraints to the field, and reduce uncertainty during excavation with digital tools.
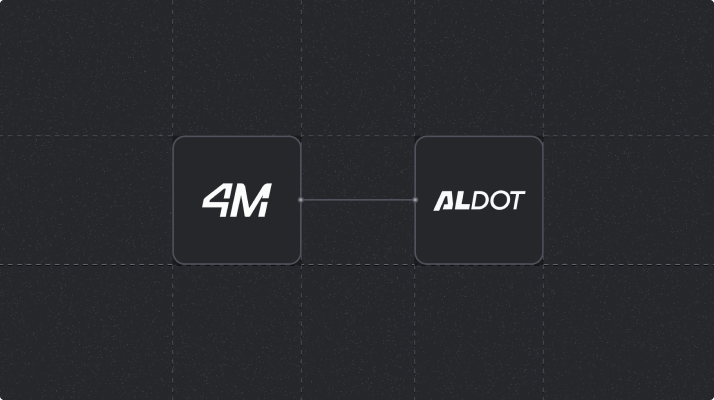
Kaustubh Page, Senior Product Director at 4M, and Dan Colbert, Geospatial Sales Manager for Utilities at Trimble, walked through a live demonstration of how AI-generated utility data can move from a desktop platform to a field crew's hands — and what that workflow looks like in practice.
The problem with “figuring it out” in the field
The traditional utility locating process can break down in plenty of places: in 811 ticket requests that go unfilled for days, utility owners that don’t respond to locate requests, phone calls to multiple potential owners just to find one record, or boots on the ground efforts that waste valuable working hours because the best data isn’t made available.
And when responses do come back, the quality of the data varies wildly. Page showed a real 811 ticket response that was a hand-drawn sketch: a rough approximation of where the utilities “most likely” are. In that case, the receiving agency is responsible for digitizing the sketch, stitching it together with other records, and turning it into something a designer can use.
In dense urban environments, the challenge isn’t a lack of data but rather data overload, where multiple sources and maps contradict each other. Page noted an example from a Dallas site: when all available public records for a water network were plotted on a single map, one record placed the water line on the left side of the road, another in the center, and a third on the right. The whole road looked like it was filled with water mains, at least according to the raw records before they’re reconciled — a process that can take weeks or months.
And for the teams doing that reconciliation, the starting point is often closer to “go figure it out” than receiving a complete picture. This isn’t because stakeholders, from utilities to municipalities to 811 teams, want to provide unreliable data or conflicting sources of truth. The problem is that over decades, the small errors and gaps grow into an unwieldy tangle of different measurements, formats, and outdated records that’s too big for any one team to unravel alone.
What evidence-based utility data actually looks like
4M is here to help unravel that big tangled knot into something useful for everyone working on a project. This process starts with collecting millions of public records — GIS data, permit records, PDFs, even property management listings that might indicate the presence of a septic tank (which would indicate the absence of a sewer connection).
The AI conflation engine then processes those records to remove duplicates, normalize coordinate systems, reconcile conflicting information, and enhance attributes by cross-referencing multiple sources. As Page noted, "When you're starting a project, you should have at least a high-level idea of where utilities are."
But the records are just the first layer. On top of that, 4M runs object detection across multiple imagery sources — street-level, aerial, and high-definition satellite — to identify on-surface indicators like hydrants, valves, and street lamps. Road mark detection is a new feature that identifies utility spray paint on pavement from street-level images from the last 12 months, with plans to go back over more than a decade of historical imagery.
What makes this so useful for engineers isn’t any single data layer. It’s the stacking.
Page walked through a specific example during the demo. A GIS record showed an underground power line in a given location. On its own, that’s a starting point, but not something an engineer can stake a project on. But then turn on the object detection layer, and there’s a street lamp nearby. Confidence goes up a notch. Then turn on road marks, and there are utility markings on the pavement that align within about a foot of the GIS record. Now an engineer can say, with supporting evidence, that a line exists within a narrow band and plan accordingly from the beginning.
"If I have to rate this line from the SUE quality levels," Page said, "I may rate this a C-plus, because I have evidence of the road mark, I have a street pole over here, and as an engineer with these two strong evidence pieces, I can say the line is within a one- or two-foot band."
This isn’t a replacement for subsurface utility engineering. But it is a much stronger starting point than most projects have ever had, and it’s delivered in hours instead of weeks, across an entire project area instead of a handful of spot checks.
When early signals prevent million-dollar problems
The practical value of having this utility data earlier in the project lifecycle was revealed in two real-world examples Page shared during the Q&A.
On a bridge project in the Houston area, the initial concept study and alignment missed a 144-inch sewerage line buried 54 feet underground. The bridge foundation design went directly on top of it. A second engineering firm brought in 4M’s data, which flagged the line. The DOT sent in a crew for in-pipe inspection, confirmed the line existed just a few feet from where 4M’s data indicated, and avoided what would have been a catastrophic conflict during construction.
On another project, a DOT had completed SUE quality level B investigation, which missed a water line. A sound barrier wall was designed directly over that missed line. Fortunately, 4M’s data identified the water line, and the DOT caught the conflict before construction. As Page noted, the domino effect of finding that kind of conflict during construction isn’t limited to one project: when a contractor is delayed, the roll-on effects of future projects also being delayed means even more costs for the site owner (and ultimately the taxpayer, in the case of DOTs).
"Identifying even one line," Page said, "could have an impact of millions of dollars in construction costs."
Taking utility data from the screen to the street
Having better data on a desktop is only half of the equation, though. The other half is getting it into the hands of the people on the project site, into what Page called “an elevated source of truth for utility data”.
Colbert demonstrated how 4M’s data flows into Trimble’s ecosystem through a web feature service API. In practice, that means a project team can generate an API key in 4M, paste it into Trimble Connect, and within a few clicks, all the utility data — lines, objects, attributes, utility owners — is available in the Trimble platform.
From there, the data can move into two different field workflows. Trimble SiteVision uses augmented reality to overlay utility data in 3D onto the real world through a tablet or phone screen. A field crew can walk a project corridor and see water mains, gas lines, and power infrastructure rendered beneath the pavement in real time, with full attribution including type, diameter, depth, and utility owner (where available).
"The idea that you can take this data out into the field with just a couple of clicks is a really powerful thing," Colbert said, "for adding context to your utility investigation process at the front end of a project."
The biggest practical implication is the potential for highly targeted investigations in the field. Instead of potholing every 50 feet across an entire corridor, a project team can identify the intersections or utility clusters that represent the highest risk and focus their SUE budget and time there.
For attribute updates and spatial corrections, Trimble TerraFlex provides a field workflow for editing utility features in place: navigating to a specific manhole or valve, verifying its type, and updating the record. That updated data can then flow back through Trimble Connect, ensuring the updates are saved for future projects as well.
Closing the utility data loop
Today, the integration between 4M and Trimble is one-directional: data moves from 4M into Trimble’s field tools. But both companies share a vision for closing that loop, making field-verified data flow back into 4M as an organization-specific layer, so the next project in the same area starts with better information than the last one.
That feedback loop is already in the roadmap for how DOTs use the platform in the future. 4M is already working with many DOTs to extract utility data from vector PDFs and process them at scale. Some DOTs and even utility owners are working with 4M to build their own organization-level layers from this existing data, which aren’t in the public domain, so in future projects they’ll be able to layer in their own as-built data every time.
The most immediate adoption, though, is happening in contexts where speed matters most. Emergency response crews and fast-turnaround projects — the kind that need to be completed in six to eight months and don’t have time for a traditional utility investigation — are using 4M as a standard starting point. It’s not survey-grade data, but it allows owners to start off with defining a fundamental risk profile, rather than delaying locating and data collection to the last moment.
As Page put it: "The point is, this is much better than not having any data."
For agencies managing dozens or hundreds of projects a year, the shift from weeks of manual research to hours of evidence-based mapping, connected directly to field workflows, changes what’s possible at the front end of every project. And every conflict caught early is one fewer surprise — or catastrophe — during construction.
FAQs
How does AI-powered utility mapping work?
AI-powered utility mapping starts with collecting millions of publicly available records, including GIS data, permit records, PDFs, and other public domain sources. An AI conflation engine then processes those records to remove duplicates, normalize coordinate reference systems, reconcile conflicting data, and cross-reference attributes across sources to determine the most accurate metadata.
On top of that record research, object detection algorithms analyze multiple types of imagery — street-level, aerial, and high-definition satellite — to identify on-surface utility indicators like hydrants, valves, and street lamps. Road mark detection identifies utility spray paint markings on pavement from historical street-level imagery. By layering these evidence sources together, AI-powered mapping can deliver a comprehensive utility map for a project area in hours rather than the weeks or months traditional record research requires.
How can utility data be used in the field during construction?
Digital utility data can be streamed directly from a mapping platform into field tools via API connections. For example, 4M's utility data can be connected to Trimble's ecosystem through a web feature service, making utility lines, objects, attributes, and utility owner information available to field crews within minutes.
From there, tools like Trimble SiteVision use augmented reality to overlay utility data onto the real world through a tablet or phone screen, allowing crews to visualize underground infrastructure as they walk a project site. Other field tools like Trimble TerraFlex allow crews to update attributes and spatial information on-site, so corrections made in the field flow back into the project record for future use. This connection between office and field helps project teams target their investigation budgets toward the highest-risk areas rather than conducting uniform investigation across an entire corridor.
Tamar Shafrir
A dedicated researcher that doesn’t stop investigating until she reaches the truth, no matter how hard it is to accept or comprehend (and there are a lot of those in our industry). Tamar took her first career steps in architecture and design, both as a practitioner and a journalist. Throughout her journey, her curiosity has taken her all across the globe, from North America through Europe to the Middle East, discovering and explaining the micro and macro challenges of the industry. Today she focuses most of her efforts on unlocking the challenges of the subsurface, through research and education.
Recent blog posts


Our Newsletter
Join 7k infrastructure professionals
Get monthly insights on ways to build smarter, faster and safer with Utility AI.